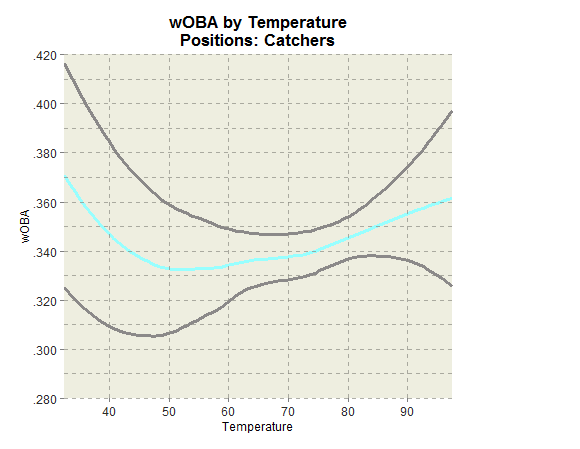
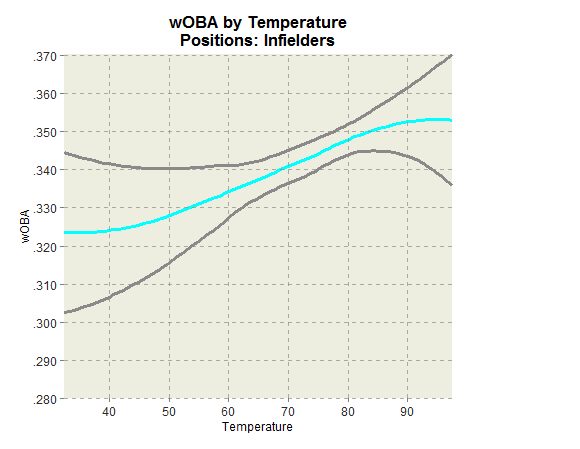
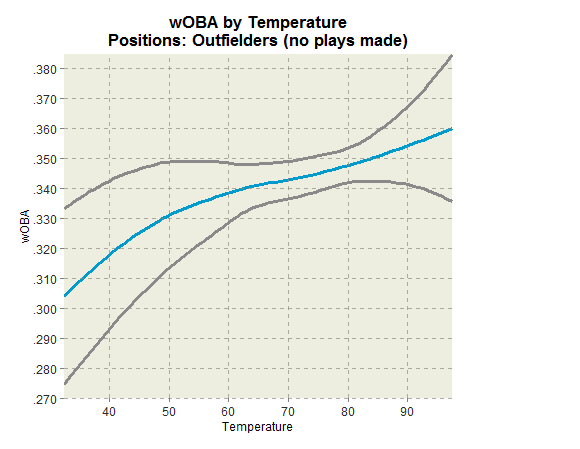
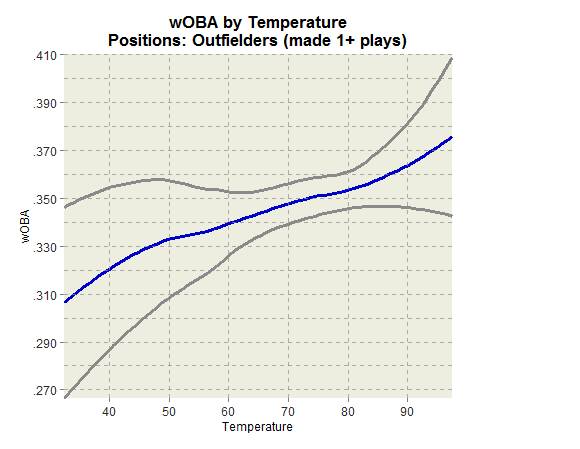
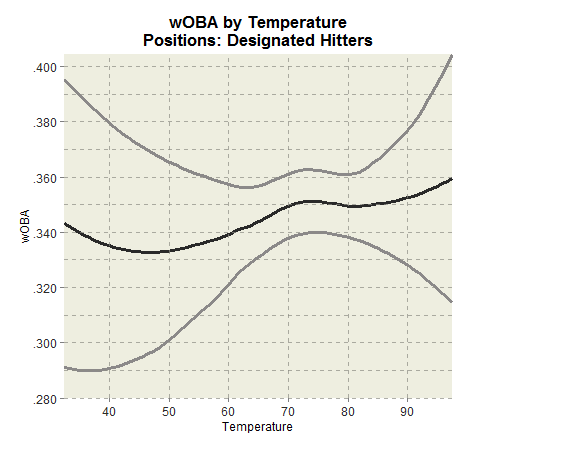
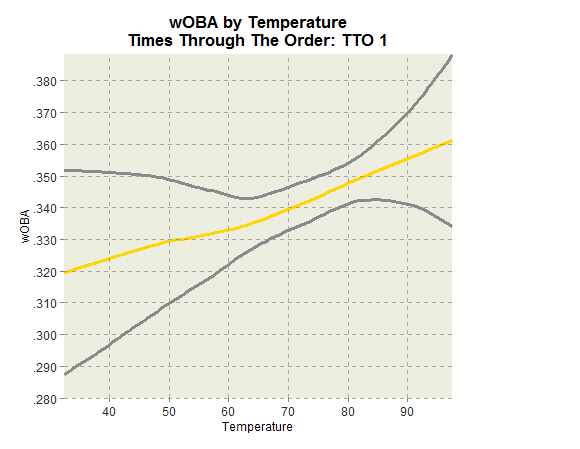
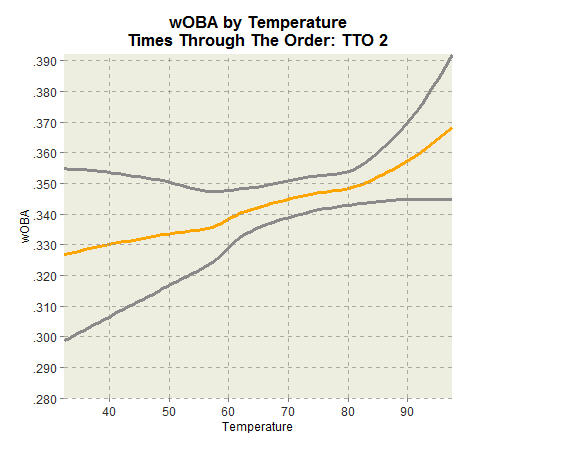
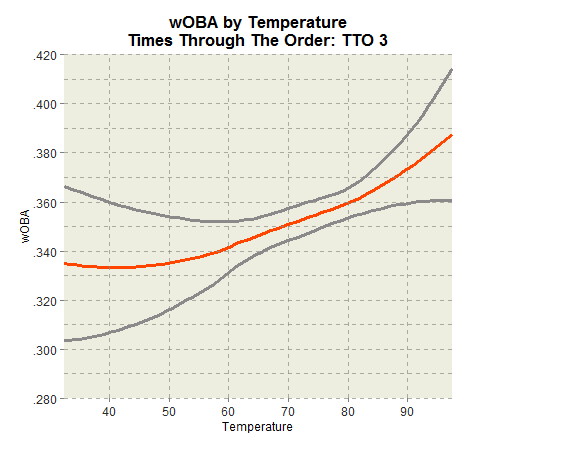
This is the appendix to my article today at The Hardball Times. Below are the smoothed 95% confidence bands of every individual curve shown in the charts you see at THT. These charts give you an idea of the considerable uncertainty found at five-degree intervals of temperature. As we would expect, these confidence intervals tighten up between ~60 and ~85 degrees, reflecting the fact that most games are played within this temperature range. Every five-degree bin is most uncertain at the very cold and very warm temperatures.
I aimed to keep these charts visually similar to those at THT, but there are some differences. Mainly, you need to watch for different y-axis scales, brought on by samples that are small for some subsets. One example is the chart below, as there are only so many plate appearances taken by catchers.
Defense
Catchers
Times Through the Order (TTO)
TTO 1
